

The Lepidoptera Log - by Steve Woodhall
Recording your garden butterflies
A smaller scale butterfly counting method
This follows on from my article on Pollard Walks .
We don’t have to venture further than our gardens to appreciate nature. We increasingly plant indigenous in our gardens. We support our local conservancies to develop parks, roadsides, and riversides to function as refuges and corridors for wildlife which can then find your garden. This is particularly so in my home city of Durban where organisations like Kloof Conservancy are working hard to support municipal efforts to protect and promote biodiversity, like the D’MOSS (Durban Municipal Open Spaces System).
Gardening for butterflies is not difficult to do. Like birds they need food and shelter. They are different to birds in that the food used by the adults is different to that used by the young (that is, caterpillars!) Adult butterflies mostly need nectar sources in the form of flowers. Caterpillars eat plants, which worries some gardeners, but with a change in mindset you can get past this. A few butterflies (and moths’) caterpillars can defoliate (strip) plants, but most rely on camouflage to avoid predators. Like birds. Many of them avoid leaving evidence of leaf eating. That is a clue birds can read when hunting for food. Much of the time you wouldn’t know the caterpillars are there at all.
There is a section on garden butterflies on this website.
Pollard Walks work best when you have a large site to work with, like a park or a nature reserve. They should be about a kilometre long and would normally take an hour or two to walk. Few of us have big enough gardens or the luxury of time to do Pollard Walks in them. Fortunately, the eBMS scheme has an option to suit the gardener – the ’15-minute timed count’. This is described here.
The UK and European versions of the app have photo guides to the butterflies found there, but the South African version is still under construction.
A guidebook such as the Field Guide to Butterflies of South Africa, or an app such as Woodhall’s Butterflies of South Africa, can help you identify the species and understand where it fits within the butterfly families. These resources should help you make a reasonable identification, but it is useful to have a way to confirm it. iNaturalist is one of the best platforms for confirming butterfly identifications.
Photographing butterflies and getting them identified is easier than ever. A computer and a modern smartphone are usually enough; you do not need an expensive mirrorless or DSLR camera, although one can help with close-up shots.
iNaturalist has useful information on how to register and upload your photos. It makes identification quicker if you have a reasonable idea of what you saw, because it has a great community of identifiers who would find your pictures more easily if you tagged them with an identification. You can also tag me, @stevewoodhall, and I will get a notification that you need some help or a confirmation of an identification.
iNaturalist has over the years built a massive database of all living things on Earth, South Africa included. At the time of writing this (late June 2026) South Africa had over 7 million records of which over 150 000 are butterflies.
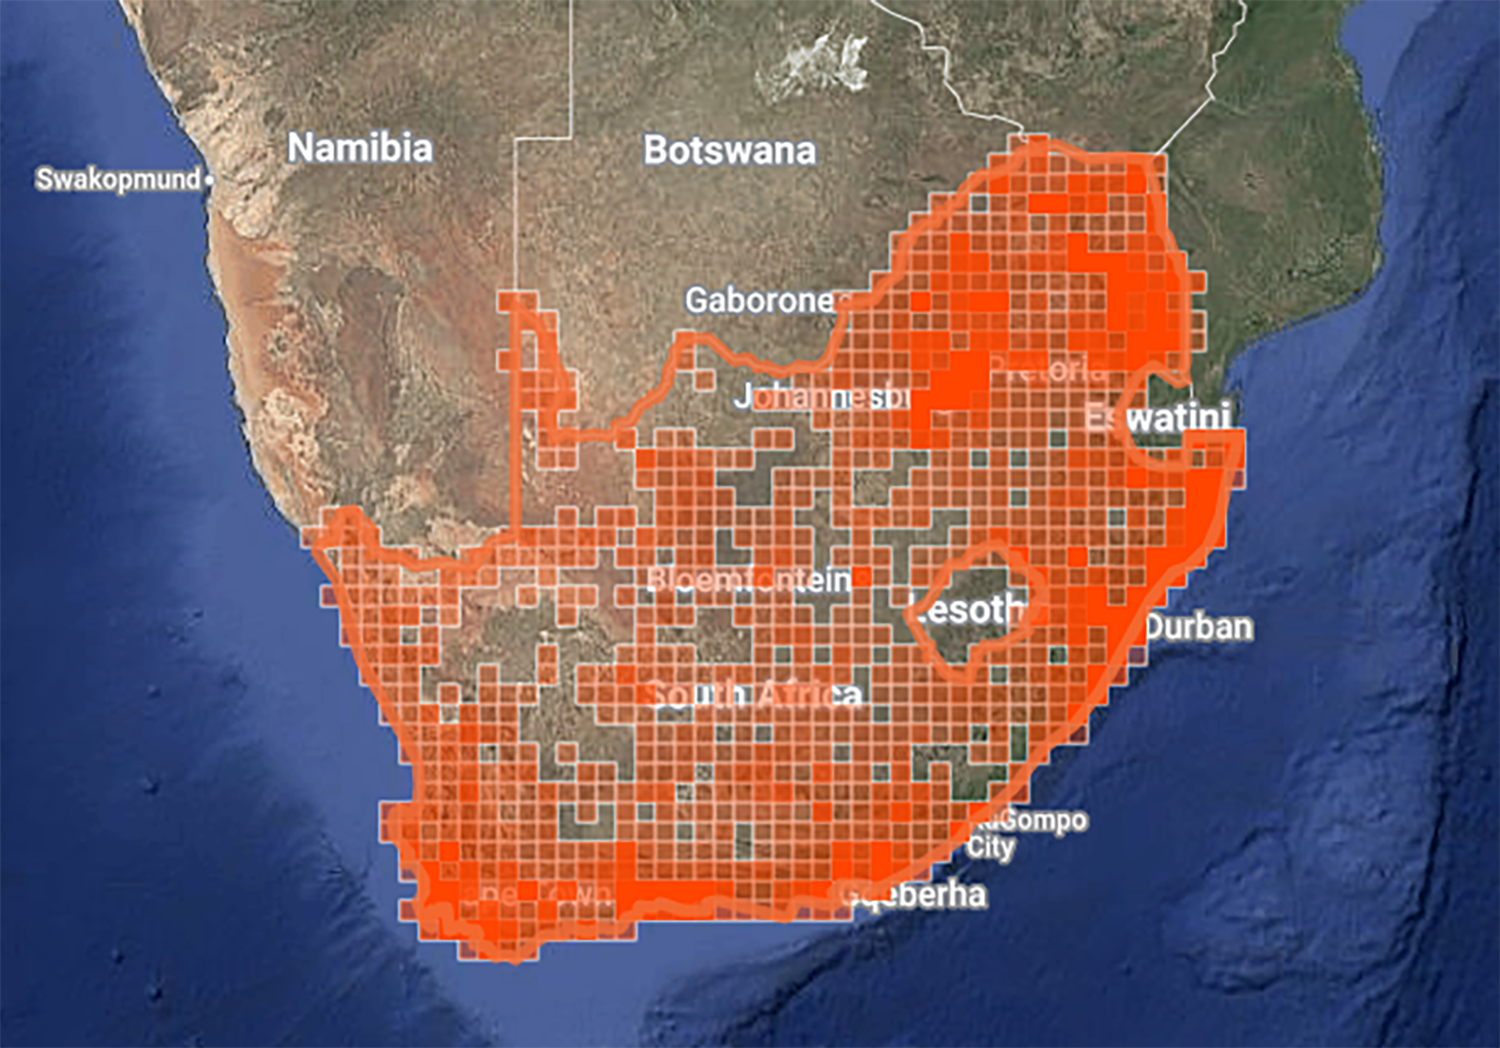
iNaturalist map of all butterfly records in South Africa
This map, taken off the iNaturalist site, shows all the grid squares that have butterfly records. The deeper the red colour the more records there are per square. It’s very easy to upload a record to iNaturalist. It will look like this one, which I uploaded recently from my garden:
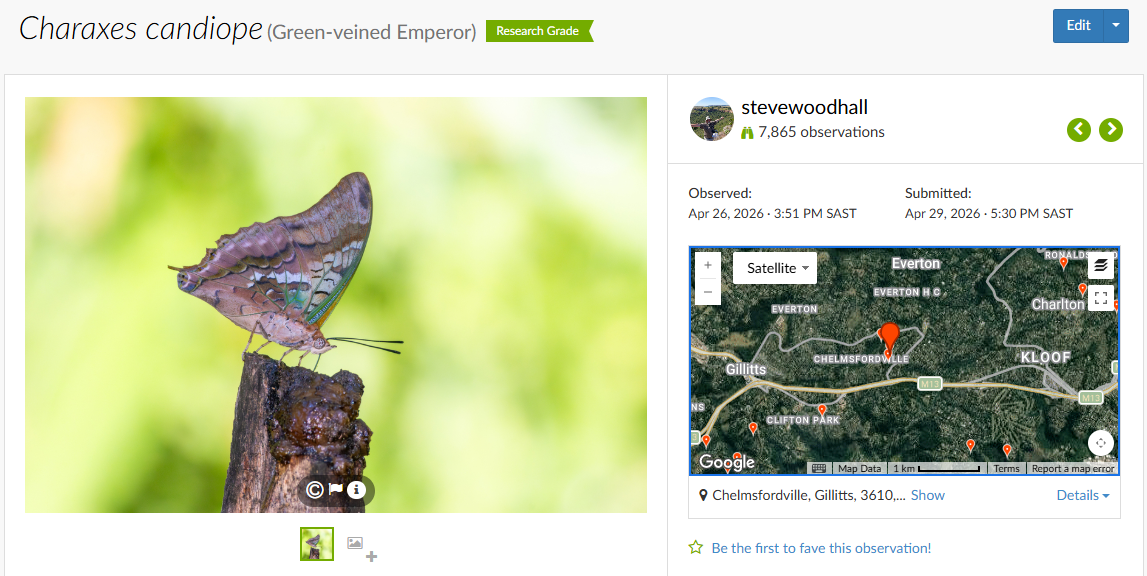
An example of a record uploaded to iNaturalist
‘Research Grade’ means that the photograph’s identification has been confirmed by one of the community of identifiers. Anyone with a free iNaturalist account can be an identifier. You don’t need a formal qualification or to sit an examination, although iNaturalist regularly runs quality control checks.
iNaturalist relies on a collaborative, community-driven approach where you simply suggest identifications based on your own knowledge and the evidence provided. The site does however give some advice on how to conduct yourself as an identifier.
That record, shown by a big red pin in the middle of the map, came from my garden, which is right next door to iPhithi Nature Reserve, inside my suburb of Chelmsfordville.
In iNaturalist you can create projects for any space, even one as small as a suburban garden. As you can see I have 863 observations, most of which are butterflies or moths (red pins) but there are also some birds and plants.
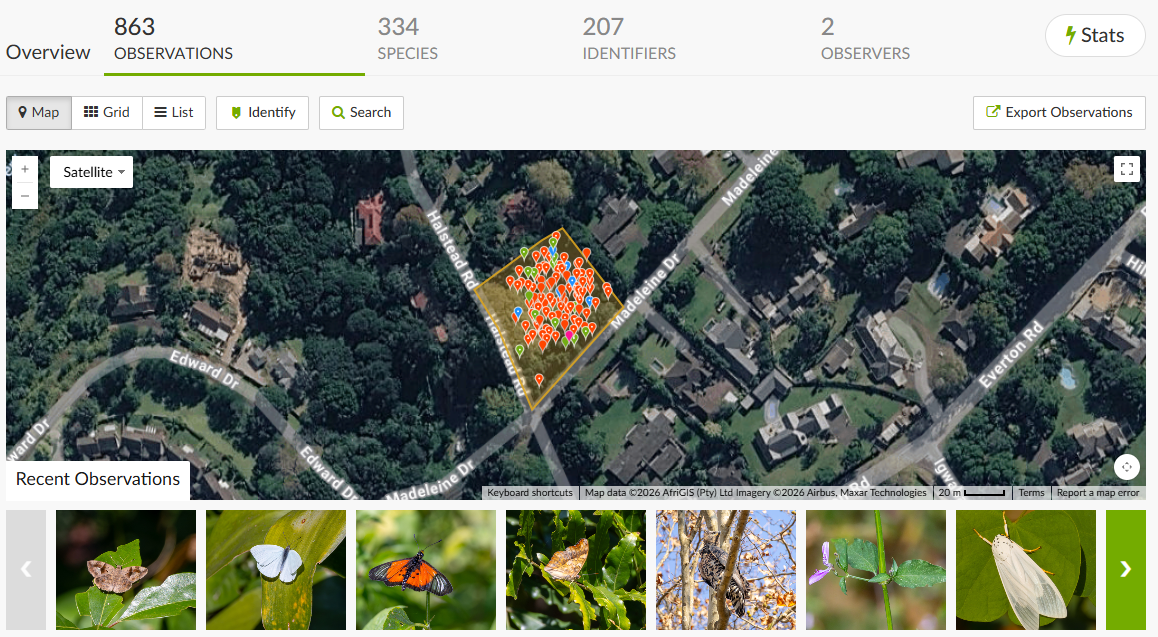
iNaturalist project map for my garden
To visualise your 15-minute timed-count data in the eBMS site, go to the top of the page and under ‘My Data.’ select ‘My Samples’. Choose the sample you want to look at: in this case it’s highlighted in blue:
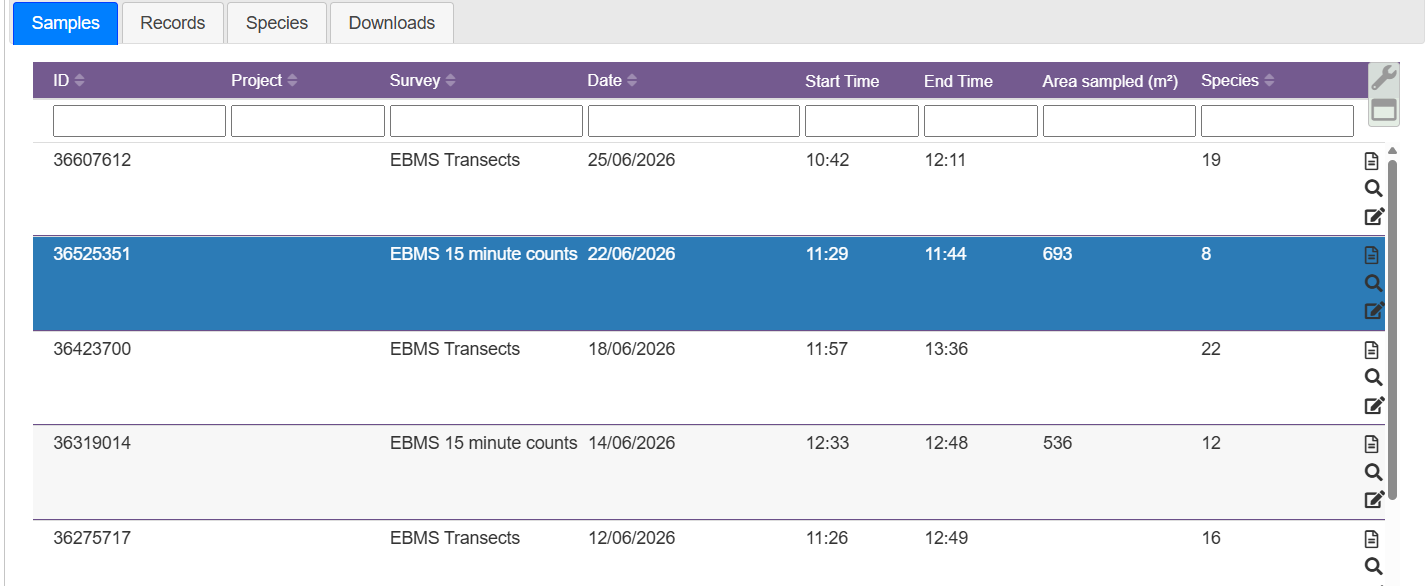
Click on the little ‘page’ icon at the top right of the blue box and ‘Sample Details’ appears. Halfway down the page, you’ll see your map:
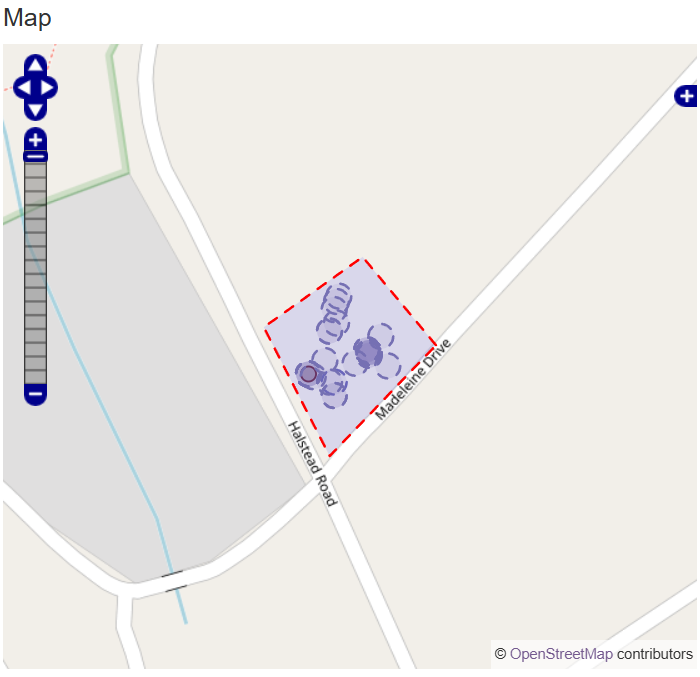
eBMS Place map for my garden
It’s quite easy to download your own 15-minute timed count data from the eBMS site. You need to do this on the BMS site on your computer. You will some MS Excel skills. Simply go to the top of the page and under ‘My Data.’ select ‘My Downloads’.

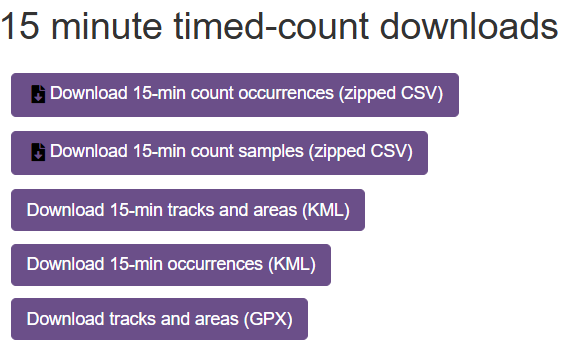
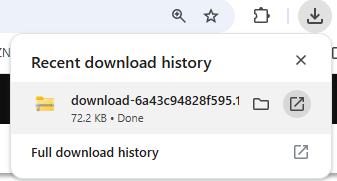
Scroll down to ’15-minute timed-count downloads’ and choose ‘Download 15-min count occurrenced (zipped CSV). Go to your download icon (top R in Google Chrome) and open the folder to see your file.

Save the file somewhere on your computer where you’ll be able to find it again. Open it in Microsoft Excel. At this point you do know how to handle Pivot Tables in Excel. Don’t worry about all the complicated columns, simply select them all and go: ‘Insert: Pivot Table’. Set it up so the field ‘Accepted Species Name’ is in the ‘Rows’ box and ‘Count’ is in ‘Values’. It will automatically choose the ‘Sum’ mode.
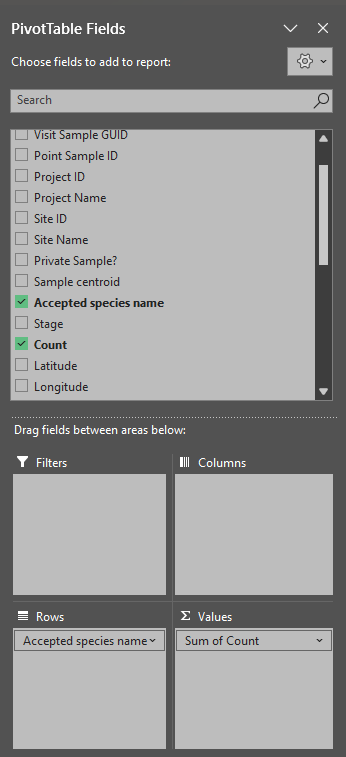
This will appear on the left hand side of the spreadsheet – a Pivot Table. You’ll see that the ‘Sum of Count column isn’t sorted.
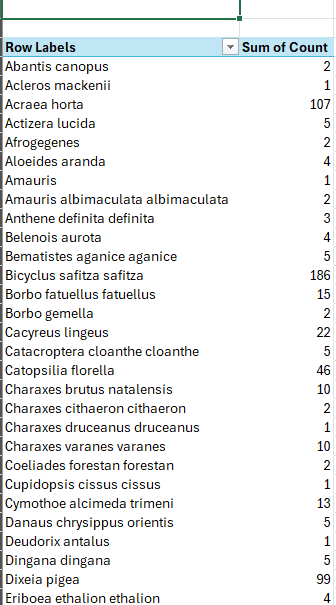
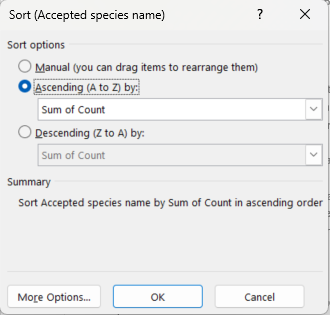
To sort it, click on the down arrow next to ‘Row Labels’ and choose ‘More Sort Options’. This will bring up the Sort dialogue box. Change the option to ‘Sum of Count’ and make it sort in Ascending (A to Z) order:
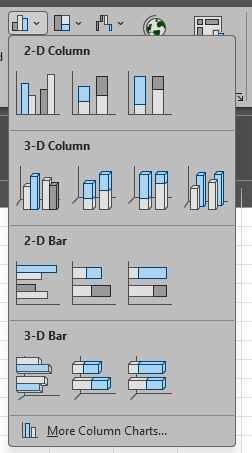
Then select the table and go to the charts section on the menu. A 2D bar chart works best. Choose it, and hey presto! A frequency chart appears.
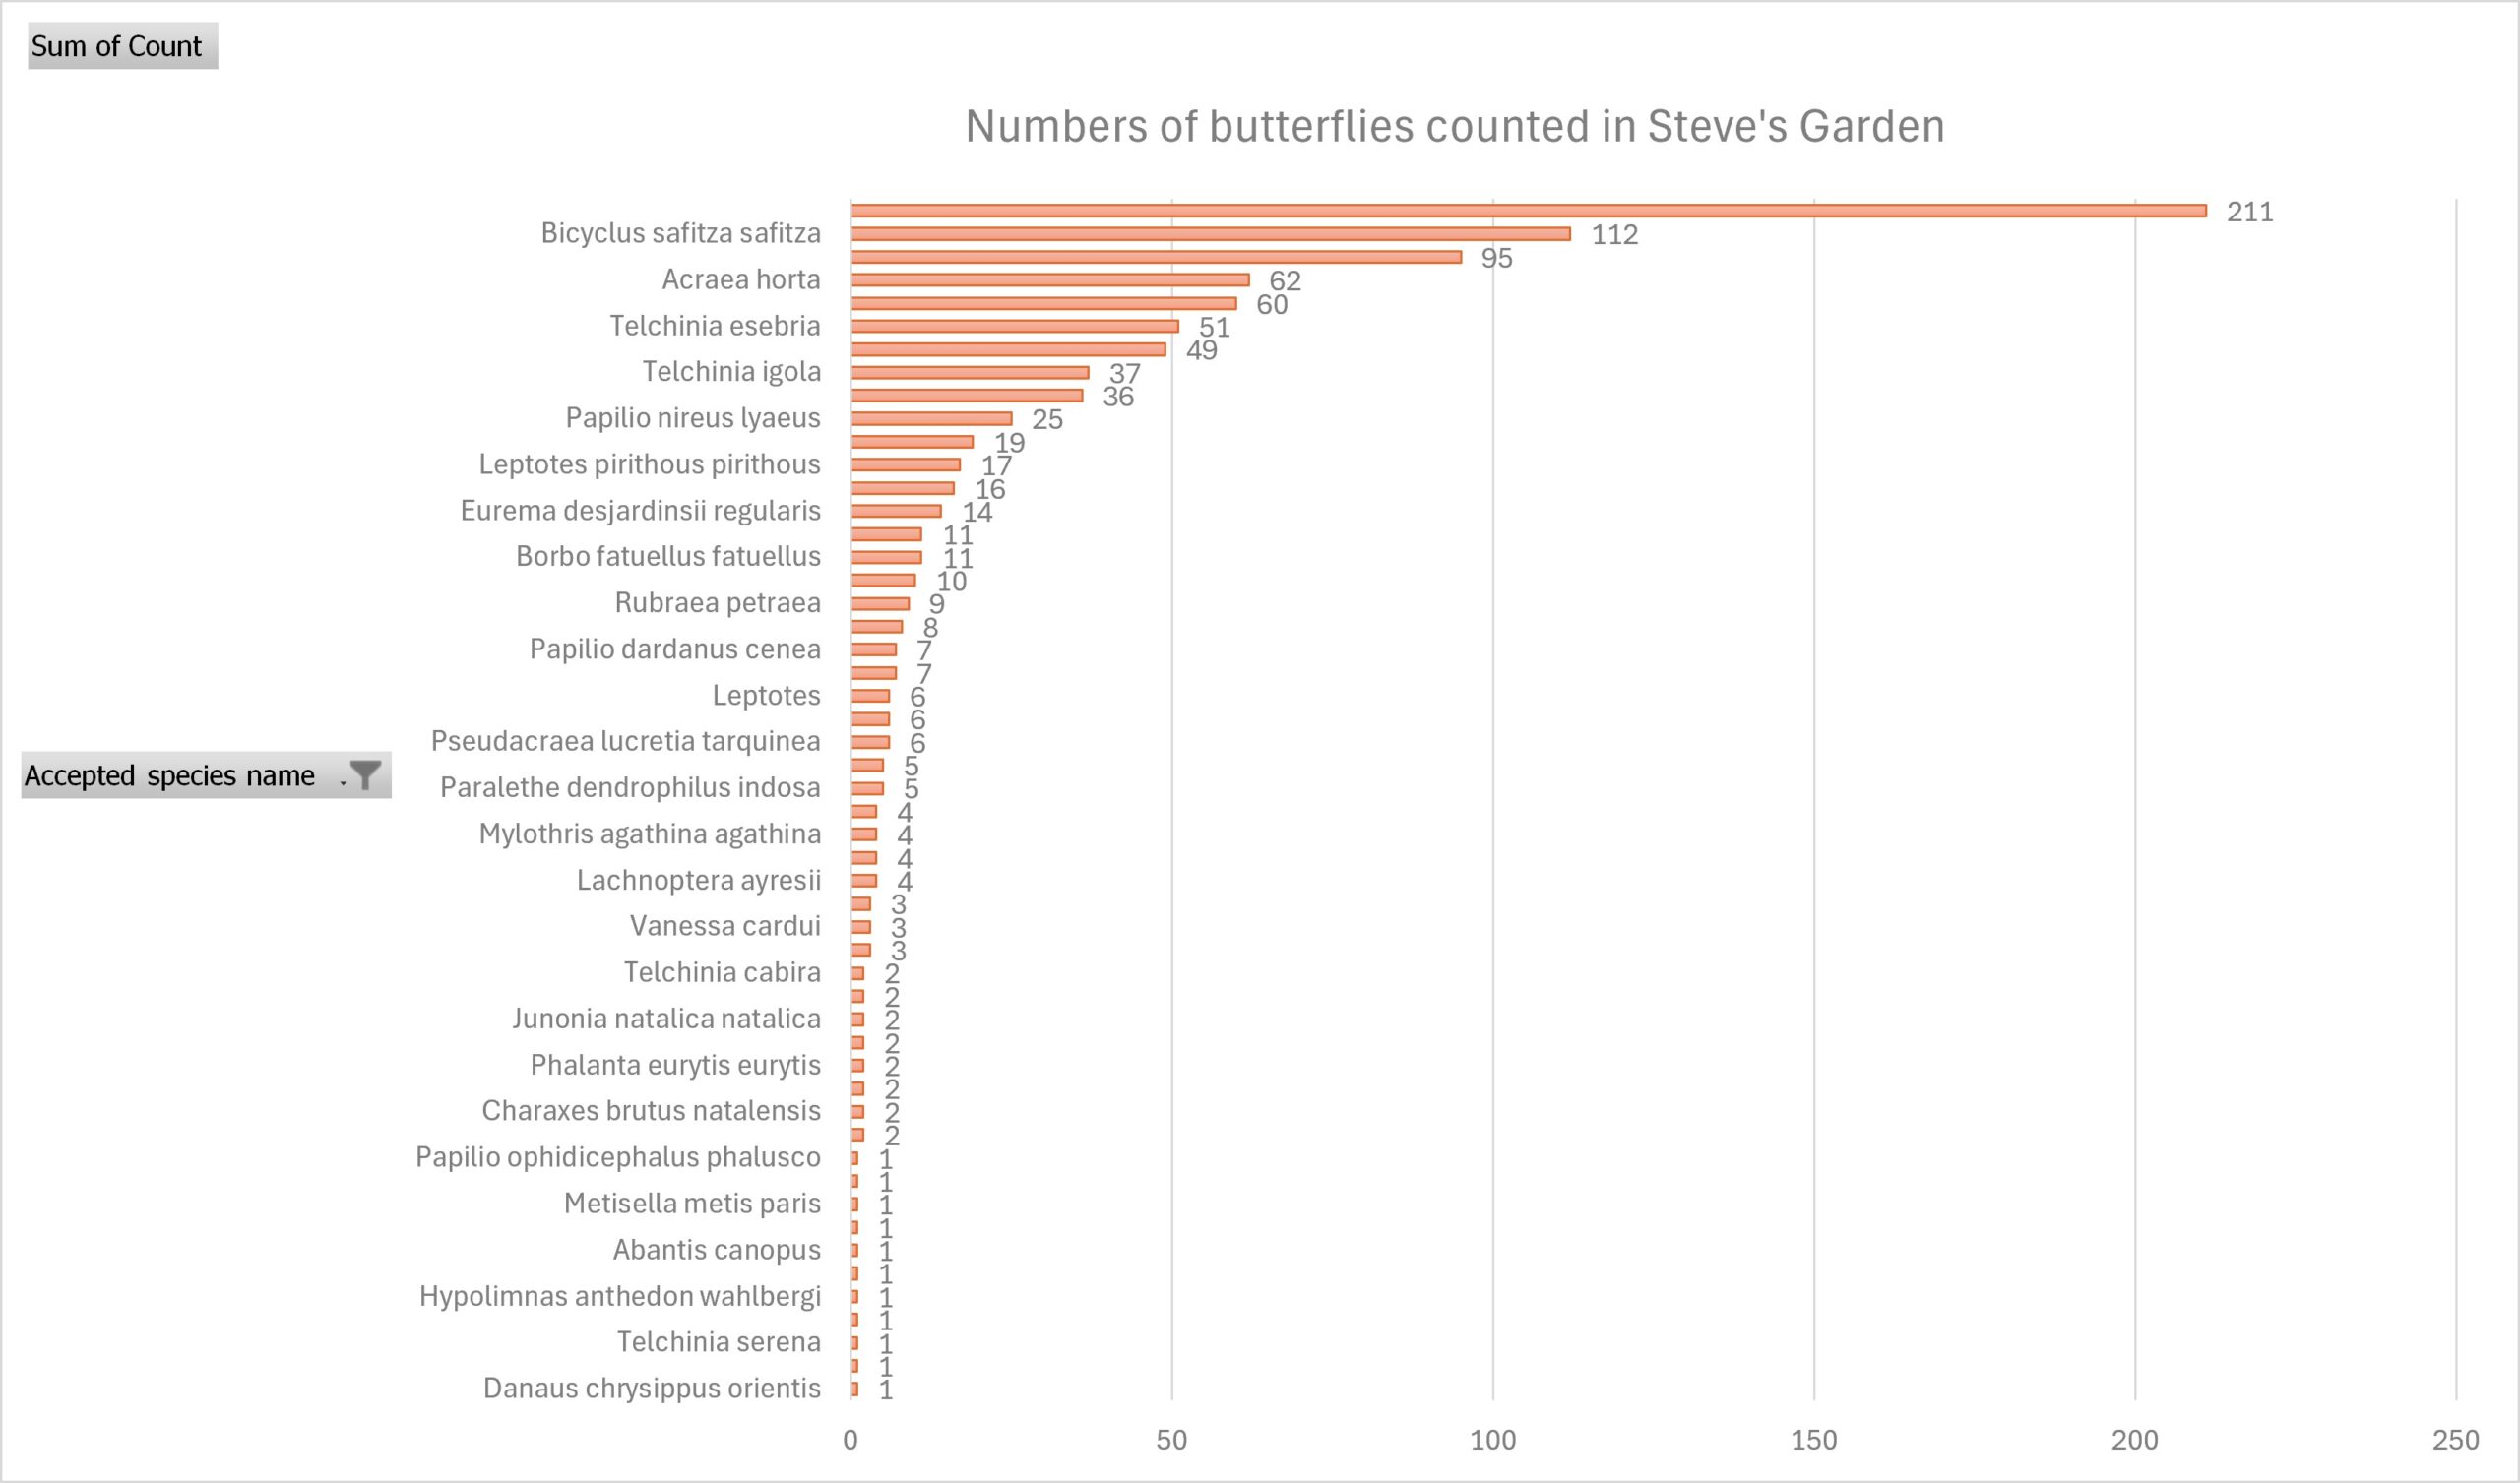
Butterfly records from my garden using 15-minute timed counts, ranked top down
Play around with the Chart Design settings until you find a colour scheme that suits you. It helps to look at ‘Add Chart Element’ and add Data Labels at the end of each bar. Now you can see what the commonest butterflies in your garden are!

Variable (or Black-haIred) Bush Brown ♂
Bicyclus safitza safitza

Garden Acraea ♂
Acraea horta
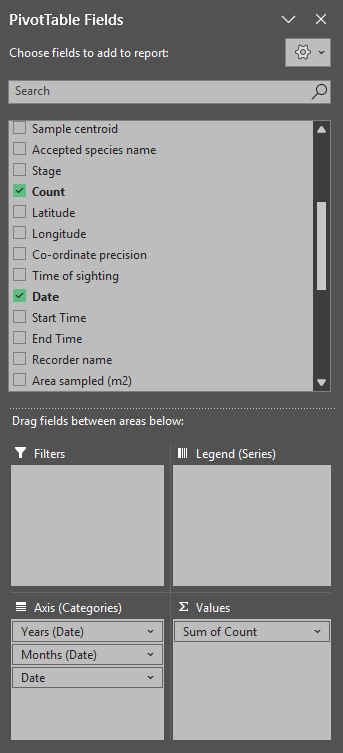
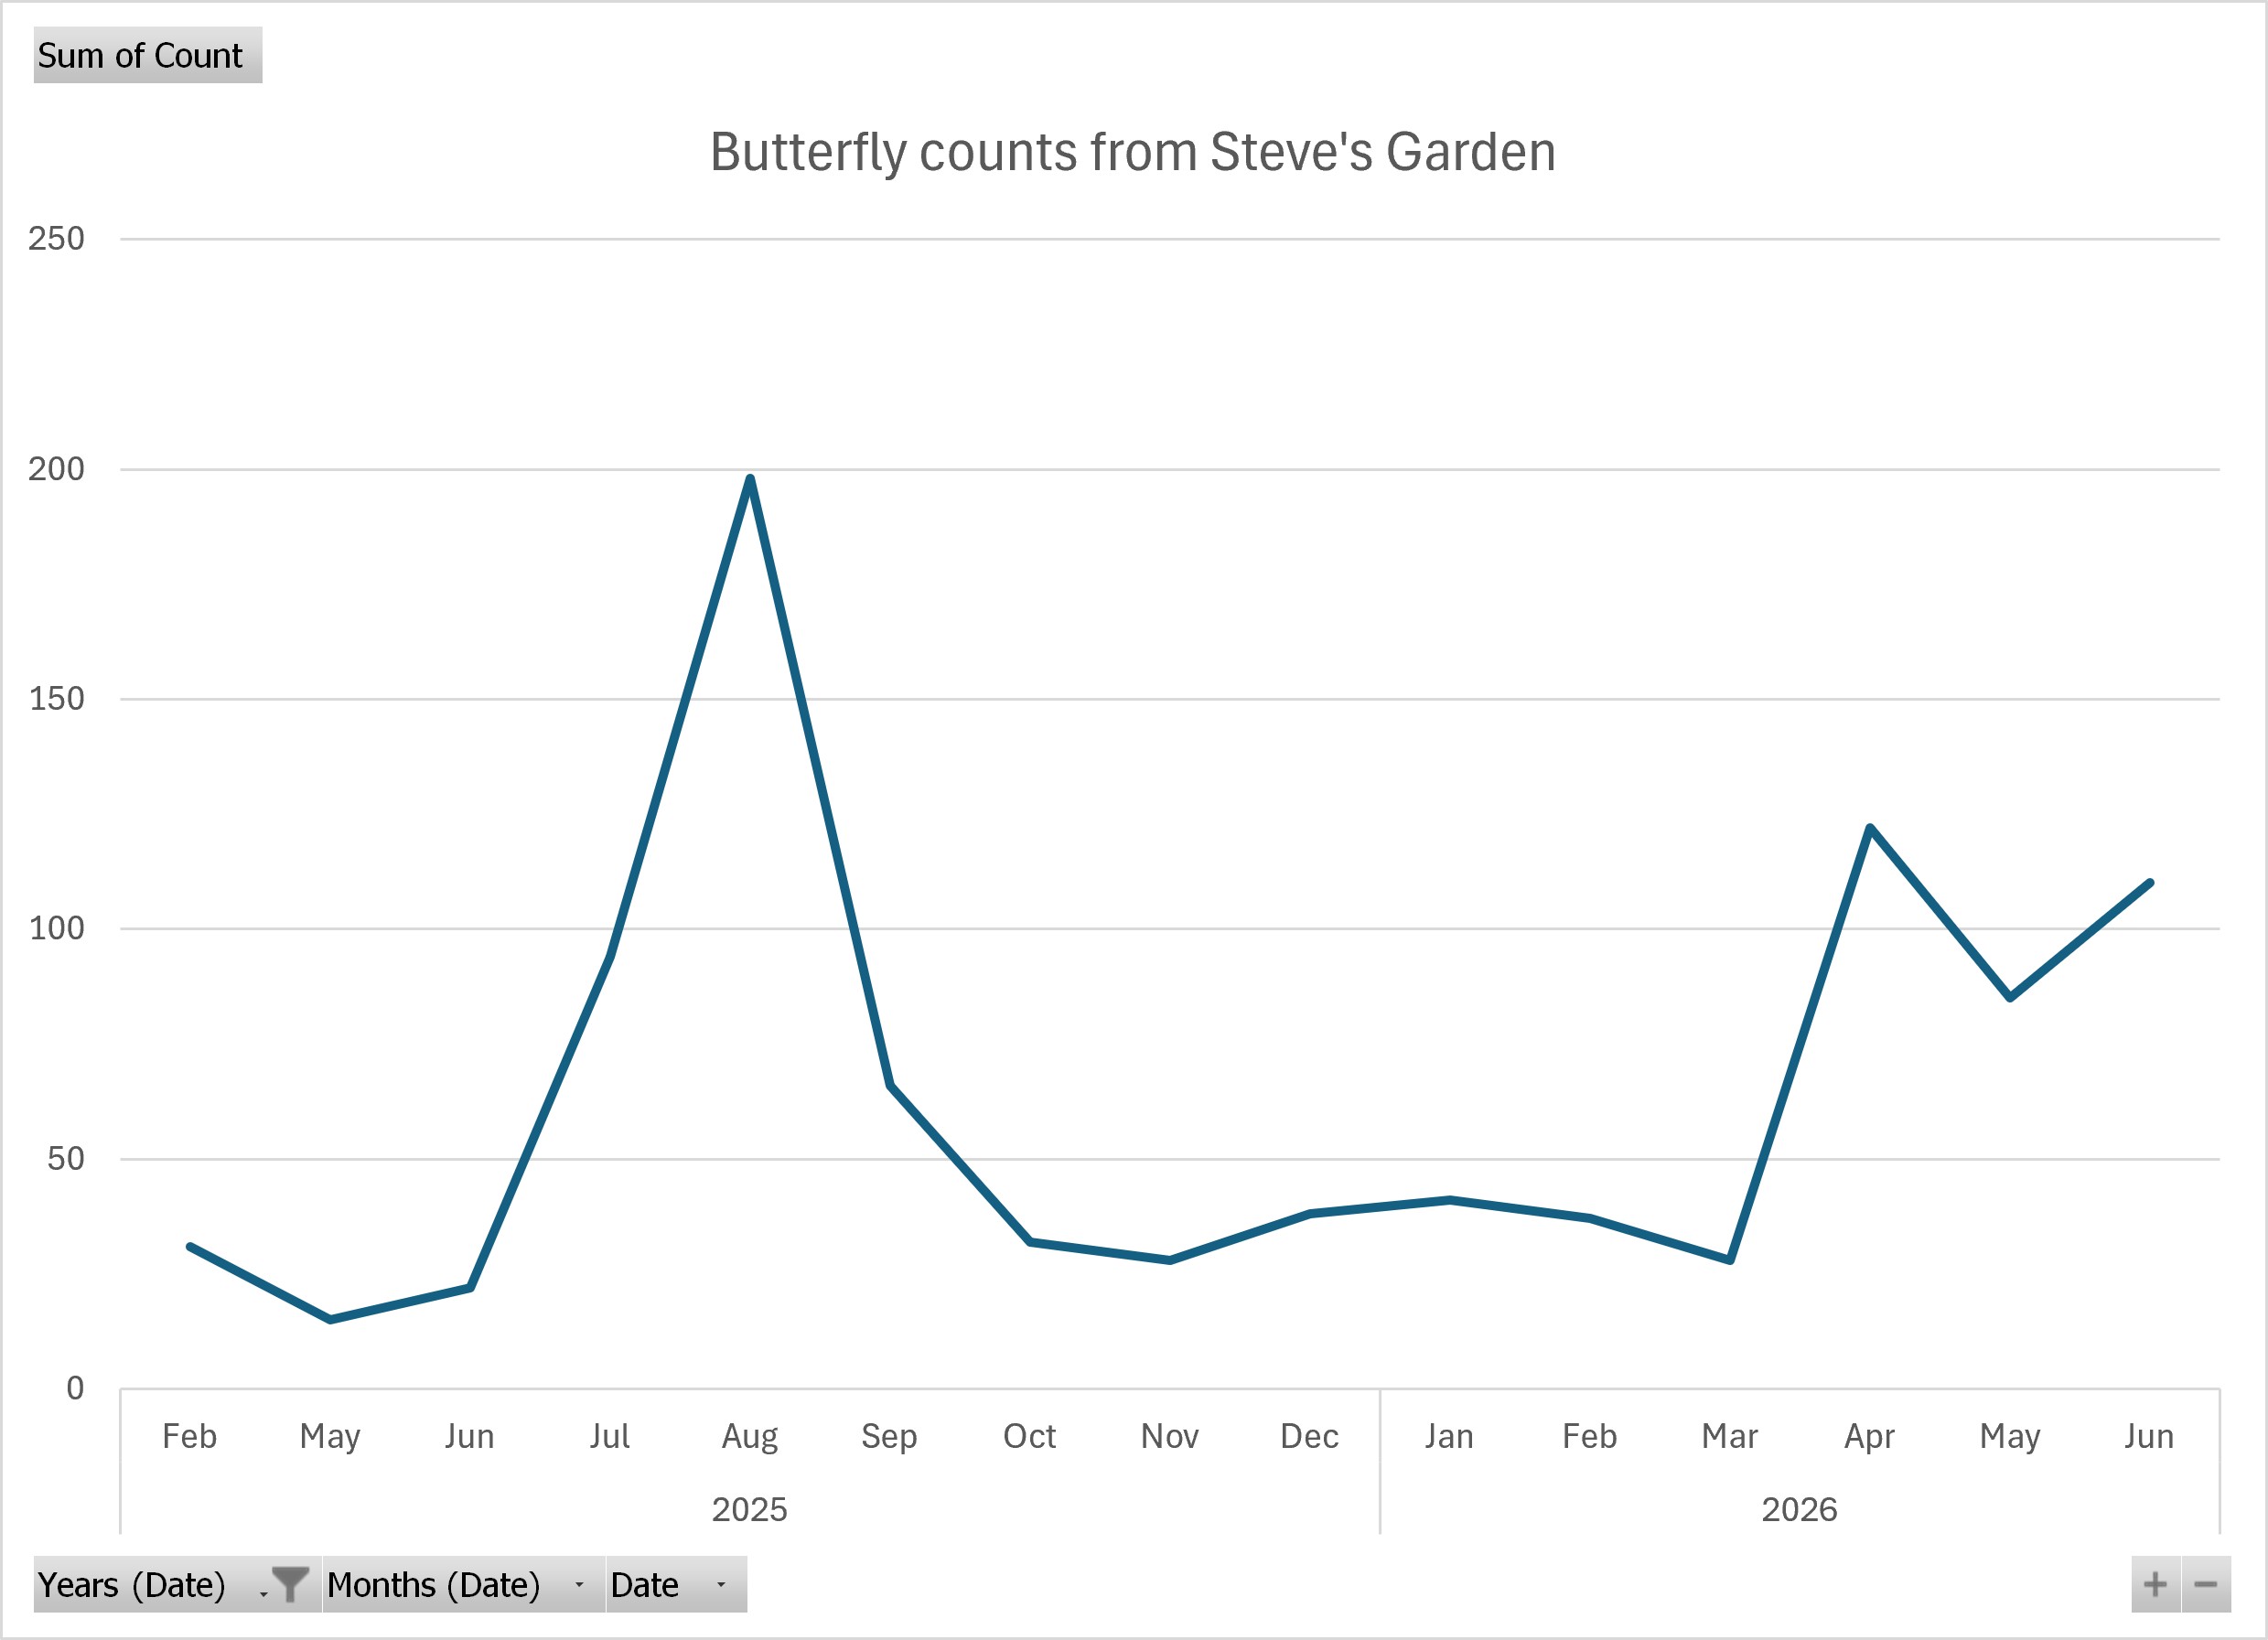
Now have a look at how your butterfly numbers change over time – create a ‘time series’. This is also done via inserting a new Pivot Table, but this time choose ‘Pivot Chart and Pivot Table’ from the Insert menu. Put ‘Count’ into the ‘Values’ box but this time put ‘Date’ into the Axis box and remove the ‘Quarters’ category. Go to the Pivot Table and remove the ‘<1 Feb 2025’ and ‘>30 June 2026’ labels, and expand the years, as shown,
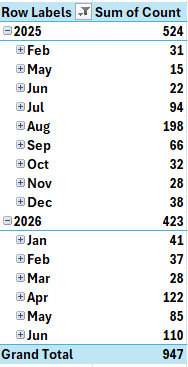
Your chart will now look like this. A peak last September and a smaller peak this April.
This was not intended as a detailed advanced Excel course, just a way to help you visualise your data. If you really want to have fun, dive into Microsoft 365’s Copilot AI, and ask it to show you graphic interpretations of your data.
If you get stuck just drop me a mail to steve@butterflygear.co.za.
Have fun!